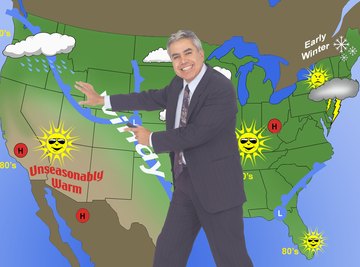
Weather describes day-to-day conditions in the atmosphere. Temperatures climb and drop, winds blow, rain and snow fall - and the sky can be gray and cloudy or clear and blue. Meteorologists study today's weather and use it to predict what will happen tomorrow. Detailed weather maps display surface weather conditions over a wide area, providing a variety of information meteorologists use for their predictions. Generalized maps in newspapers and on television illustrate some of the data to help keep ordinary people aware of the weather.
Temperature
Surface weather maps show air temperature recorded at official stations. Depending on a map's purpose, it may display the current temperature, the high or low temperature in the past day or the predicted temperatures. Many maps use isotherms - lines connecting points with the same temperature - to show areas of similar temperature. Color is also useful for temperature maps: hot areas are shades of red, and cold areas are blue and violet.
A detailed map also shows the dew point temperature, the temperature at which the relative humidity would reach 100 percent. This information helps forecasters predict rain or snow.
Barometric Pressure
Surface weather maps show how the atmospheric pressure, or barometric pressure, varies. This is important because masses of air with relatively low or high pressure move across the Earth's surface, changing the weather as they pass. Low pressure is often accompanied by storms, with the lowest pressures at the center of hurricanes.
Barometric pressure is recorded at official weather stations along with temperature. Pressure readings are printed at each station on detailed maps. On generalized maps, the barometric pressure is summarized into a contour map: lines connecting points of equal pressure, called isobars, curve across the map. Labels on isobars allow readers to observe regional pressure trends and locate zones of high and low pressure. Large letters "H" and "L" mark the centers of high- and low-pressure cells.
Weather Fronts

Fronts are the edges of moving air masses. They are shown on maps by heavy lines with additional symbols to show the direction of movement. A line showing a cold front has triangles pointing in the direction the air mass is moving, while warm fronts have half-circles on the side toward which the air is moving. If an air mass stops moving, it becomes a stationary front marked by a line with triangles on the cool side and half circles on the warm side.
The location and movement of fronts is important, especially cold fronts. That is because passing cold fronts often bring storms, even violent storms containing tornadoes. Once a cold front has passed, the air is cooler and drier than before. Warm fronts are not usually accompanied by storms, but they may be marked by large areas of continuous rain. The air is warmer and more humid in a warm front's wake. Storms may follow a stationary front like trains on a track, dropping large amounts of rain over a narrow band.
Precipitation
Generalized weather maps show predicted rain or snow. Patterns on the map show areas where rainfall or snowfall is predicted, plus special symbols for thunderstorms, hail, sleet and ice.
Detailed maps show the cloud cover at reporting stations with coded circles. An open circle means that the sky is clear, while a filled circle means conditions are overcast.
Wind Speed and Direction
Detailed maps display wind with symbols that show both wind speed and direction. These symbols have small flags that show the wind speed in knots (one knot equaling 1.852 kilometers per hour, or 1.151 miles per hour). Wind information is not displayed on general maps, although an experienced reader can estimate wind direction and speed from other information.
You can estimate wind direction because the winds circle a low-pressure cell counterclockwise and a high-pressure cell clockwise. The wind usually blows nearly parallel to the isobars in a region. The isobars also allow you to estimate how hard the wind is blowing: it is windy where isobars are close together and almost parallel, and calmer where the isobars are far apart and cross the map randomly.
References
Resources
About the Author
Kelvin O'Donahue has been writing since 1979, with work published in the "Arizona Geological Society Digest" and "Bulletin of the American Association of Petroleum Geologists," as well as online. O'Donahue holds a Master of Science in geology from the University of Arizona, and has worked in the oil industry since 1982.
Photo Credits
SW Productions/Brand X Pictures/Getty Images